03
NEW MINING.
Our Asset
Permitted power,
ready today.
20 MW
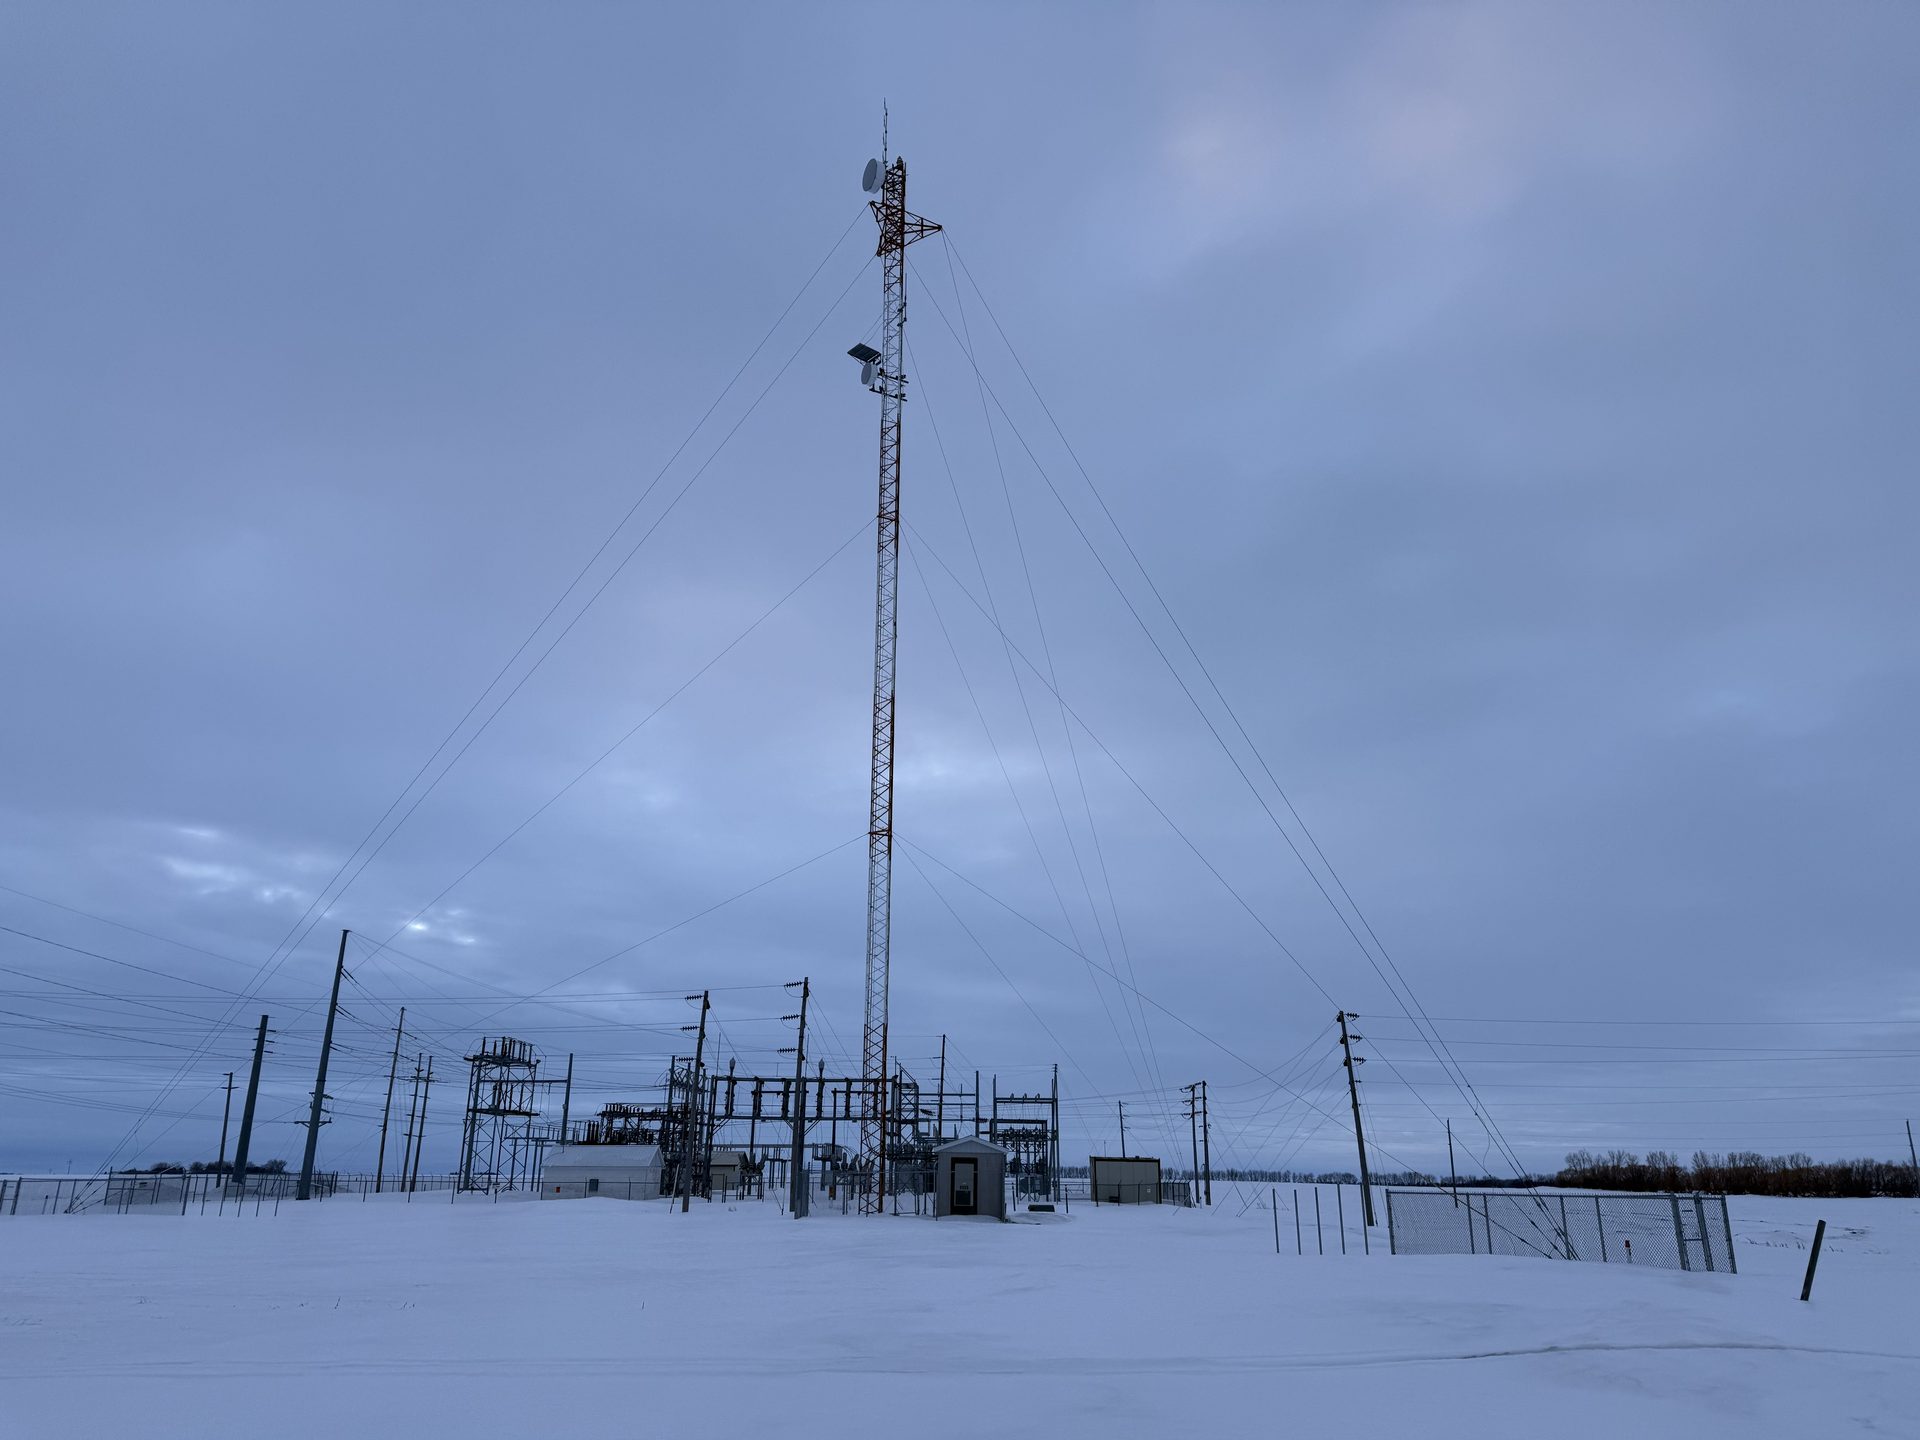
permitted · behind-the-meter · north dakota
- Substation-direct interconnection — no years-long utility queue.
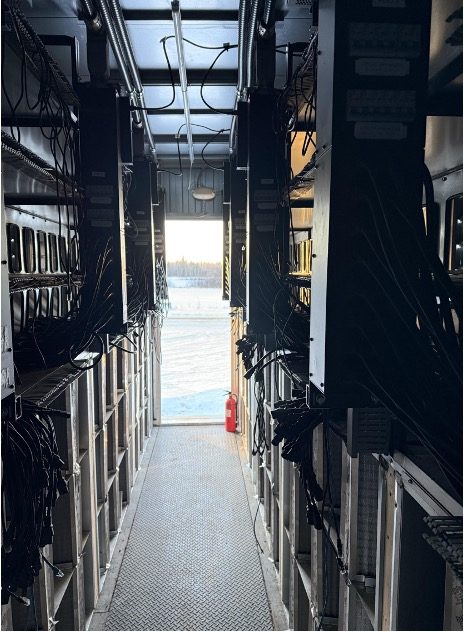
- Containerized infrastructure already on-site; pad prepared for liquid-cooled GPU modules.
- MISO grid, no state corporate income tax, fiber on property, cold climate (PUE advantage year-round).
- ~200 miles north of CoreWeave + Applied Digital's Ellendale campus — same grid region, same climate thesis.
+12 MW
Near-term (2026)
+15 MW
Mid-term (2027)
77 MW
Total Roadmap
Langdon, ND